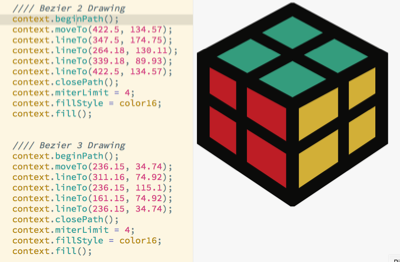
In this article, I'll talk about the different graphic formats used for visualizing data and examine some of the differences. Since most visualizations are handled in just a few different vector graphic formats, we'll see why using vectors has advantages over bitmaps because it allows us to illustrate as well as create interactions with very little overhead.

If your goal is to create visualizations for online consumption, it's good to understand the fundamentals of how graphic formats work for online delivery. In this article, I'll talk about the different bitmap/raster graphics and some of the main considerations for online delivery.
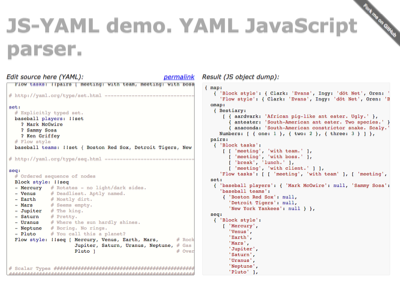
In order to work with data-visualization, it's important to understand the formats commonly used to generate visual data. In this article, I'll talk about different formats for storing data plus their advantages and disadvantages and give you some resources.
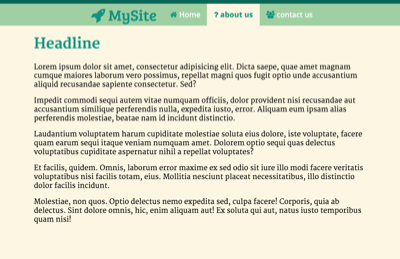
Getting a menu to center horizontally is surprisingly hard, especially when you're using CSS lists. In this tutorial, I'll show you how to change the display element to pretend you're centering a table, which is easy.
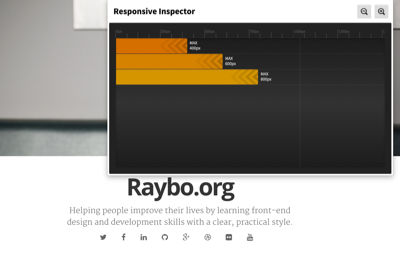
Google Chrome Extensions can help you take care of certain tasks quickly. Here's a quick review of some of my favorite extensions for web design and development.